Open to roles and freelance · Melbourne

Turning messy data into decisions people trust.

I'm Alex Patrick, a data and insights professional with 10+ years across consulting and enterprise analytics. I build dashboards, automate reporting and turn survey data into stories leaders act on.

View my work ↓Work with me →
how I got here

Analyst by training, storyteller by habit.

I've spent more than a decade helping organisations make sense of their data. I started in engineering, moved into marketing and analytics, and spent over eight years at Deloitte delivering research, performance insights and reporting for senior leaders across marketing and business development.

Today I lead survey analytics, dashboarding and reporting automation work in Melbourne. My days sit where analytics meets data engineering: writing SQL pipelines, building Power BI and Tableau dashboards, automating reports with Python, and turning thousands of survey responses into insight a leadership team can use.

Alex Patrick signature
Engineer by degree, data person by obsession.
Working with clients in Australia and India, remote friendly.
10+Years in analytics and insights
100+Stakeholders using dashboards Alex built
40%Faster reporting turnaround through automation
99%+Data accuracy maintained through QA workflows
the journey

Every stop taught me something.

From Hyderabad to Melbourne. Hop between the stops to follow the flight.

Stop 1 of 3

Deloitte

Senior Analyst, Marketing & Business Development

March 2015 to May 2023 · Hyderabad, India

  • Delivered research, analytics and insight led reporting for marketing and business development across the firm.
  • Designed KPI frameworks and dashboards used by 50+ senior stakeholders for strategic planning.
  • Applied trend, variance and segmentation analysis to find performance drivers and campaign insights.
  • Enabled self service analytics, reducing dependence on central teams by 30%.
selected work

Things I shipped, and the numbers they moved.

Data engineeringAutomation

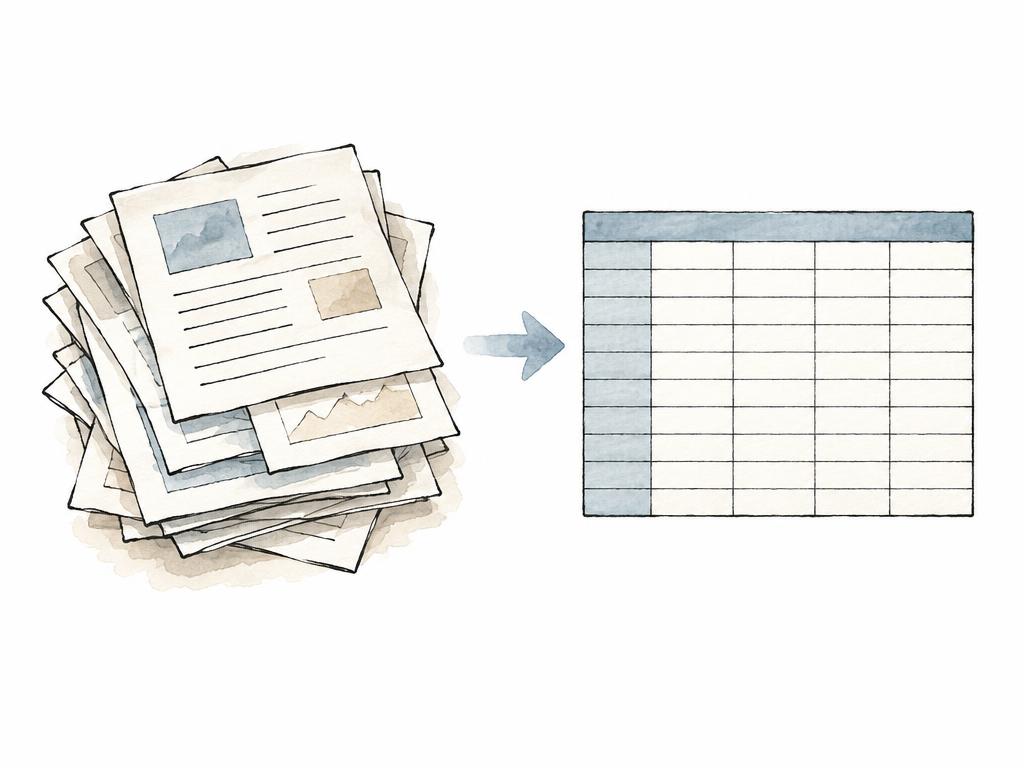
Sponsor list OCR pipeline

Turned a 129 page scanned PDF into a clean, searchable dataset of 3,553 accredited sponsors.

3,553 unique sponsor names in a styled, filterable Excel workbook.
PythonTesseract OCRpdftoppmpandasExcel
Read the case study →
01
Automation

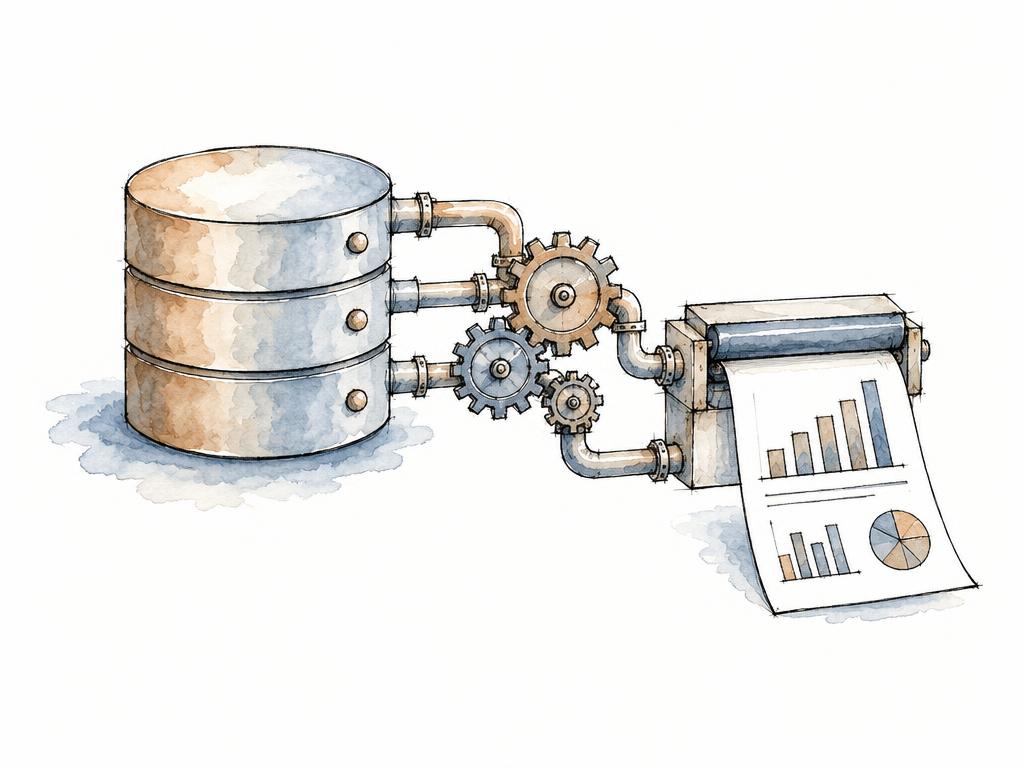
Reporting automation with Python and Oracle

Python automation that runs complex SQL analytics and cuts manual extraction time by 70%.

Manual extraction and analysis time reduced by 70%, giving leadership and operations teams faster insight.
Pythonpandascx_OracleSQLOracle
Read the case study →
02
Survey analyticsDashboards

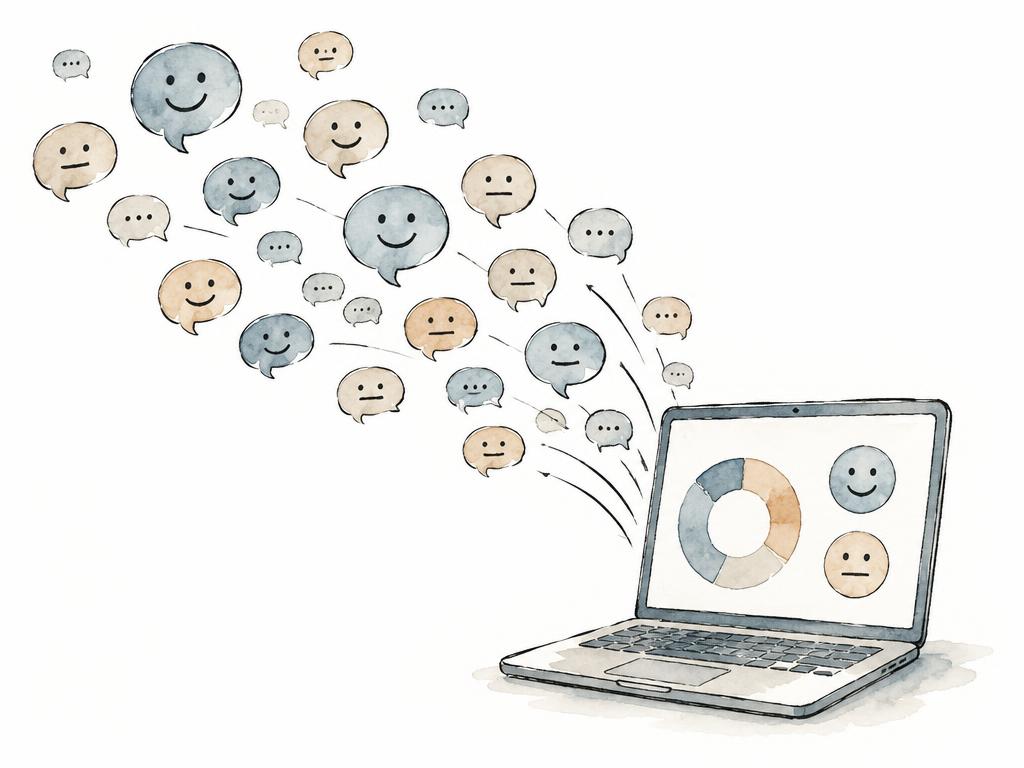
Survey comment sentiment dashboard

NLP sentiment analysis on open text survey comments, surfaced in an interactive dashboard.

Leaders could see what people felt and why at a glance, instead of reading raw comments.
PythonVADER (NLP)Power BISQL
Read the case study →
03
DashboardsPersonal project

Personal ride history analysis

An in depth Tableau analysis of my own Uber ride history in Hyderabad since 2019.

A personal data story showing how ride habits, costs and wait times changed over the years.
Tableaucalculated fieldsdata cleaning
Read the case study →
04
Dashboards

Victorian crime statistics dashboard

An interactive dashboard exploring crime trends across Victoria using public data.

Power BI
Read the case study →
05
Dashboards

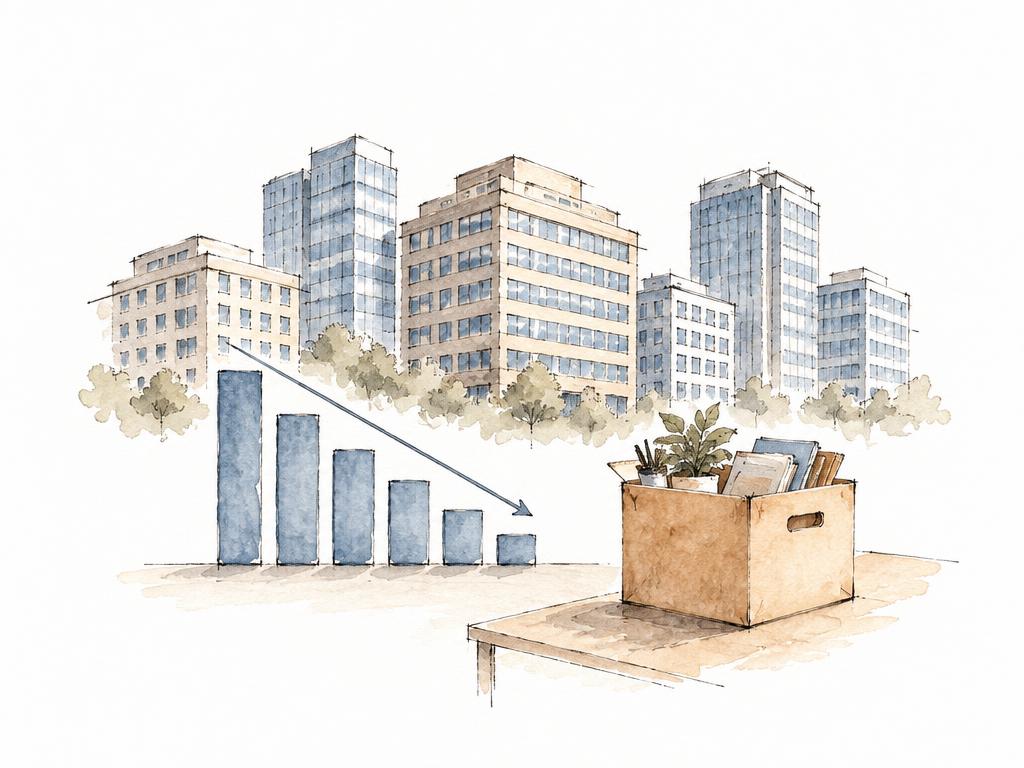
Layoffs trends dashboard

Tracking layoffs across companies, industries and countries to reveal patterns over time.

[PLACEHOLDER: tool used]
Read the case study →
06
Dashboards

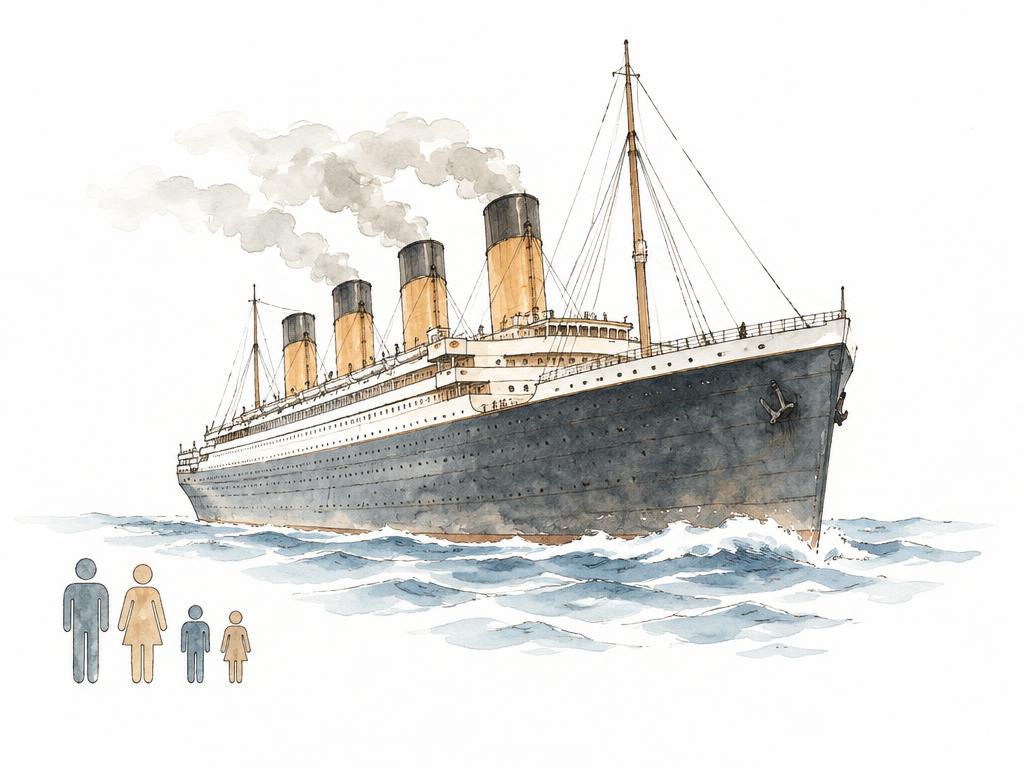
Titanic data infographic

A Tableau infographic on Titanic passenger survival, with dataset figures validated against historical records.

Tableau
Read the case study →
07
DashboardsFreelance

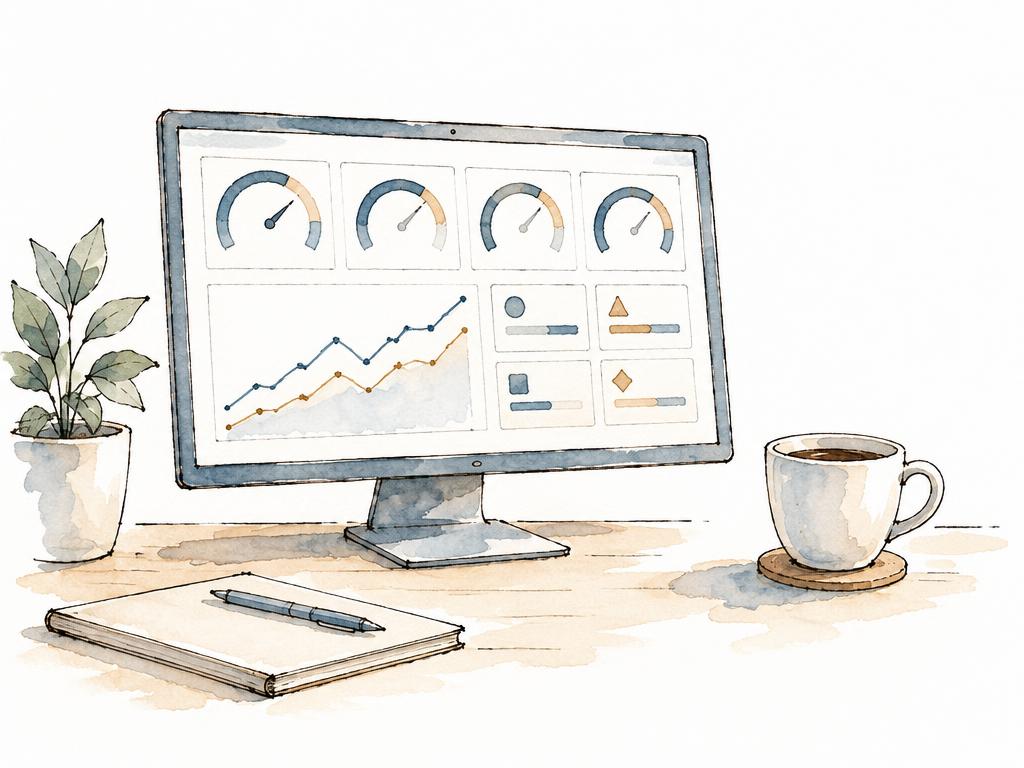
Business performance dashboard (freelance)

A Power BI dashboard giving a client a single view of business performance and key metrics.

Power BI
Read the case study →
08
how I can help

I start with the numbers, then go find the people.

01

Dashboard development

Interactive Power BI and Tableau dashboards built around your KPIs.

KPI designdata modelpublished dashboardhandover guide
02

Reporting automation

Replace manual spreadsheets with automated Python and SQL workflows.

Automated scriptsscheduled refreshQA checks
03

Survey and voice of customer analytics

From survey design to insight reports that leaders act on.

Survey setup (Qualtrics)analysissentiment and themesinsight report
04

Data analysis and insights

Trend, variance and segmentation analysis to find what's driving performance.

Analysisfindings deckrecommendations
05

Digital marketing analytics

Campaign tracking and performance reporting across Google and Meta Ads.

Ads reportingcampaign dashboardsperformance reviews
06

Data cleanup and pipelines

Clean, structured, analysis ready data from messy sources, including scanned PDFs.

Cleaned datasetsdocumented ETL logic
my stack

Everything I know, unwrapped.

Analytics and visualisation

Power BITableauExcel (advanced)Power QueryOracle Analytics CloudSPSS Modeler

Data and engineering

SQL (SQL Server, Oracle)Python (pandas, cx_Oracle)ETLdata validation and QADuckDBDomo APIPostman

Survey and research

Qualtrics XMExplorance Bluesurvey design and analysissentiment analysis (NLP)quantitative and qualitative research

Digital marketing

Google AdsMeta Adscampaign performance reportingWordPressElementorShopify

Ways of working

KPI framework designexecutive storytellingstakeholder managementmentoringJIRAServiceNow

Currently learning

Microsoft FabricAzure data servicesdbt
certifications

Paper that backs it up.

Microsoft PL-300: Power BI Data Analyst

[PLACEHOLDER: status]

Microsoft DP-900: Azure Data Fundamentals

[PLACEHOLDER: status]

Microsoft DP-600: Fabric Analytics Engineer

[PLACEHOLDER: status]

dbt Fundamentals

[PLACEHOLDER: status]
off the clock

Calculated chaos.

A desk of things from my projects. Go on, move them around.

ride data, 2019 on

SQL first, charts second.

Titanic, validated

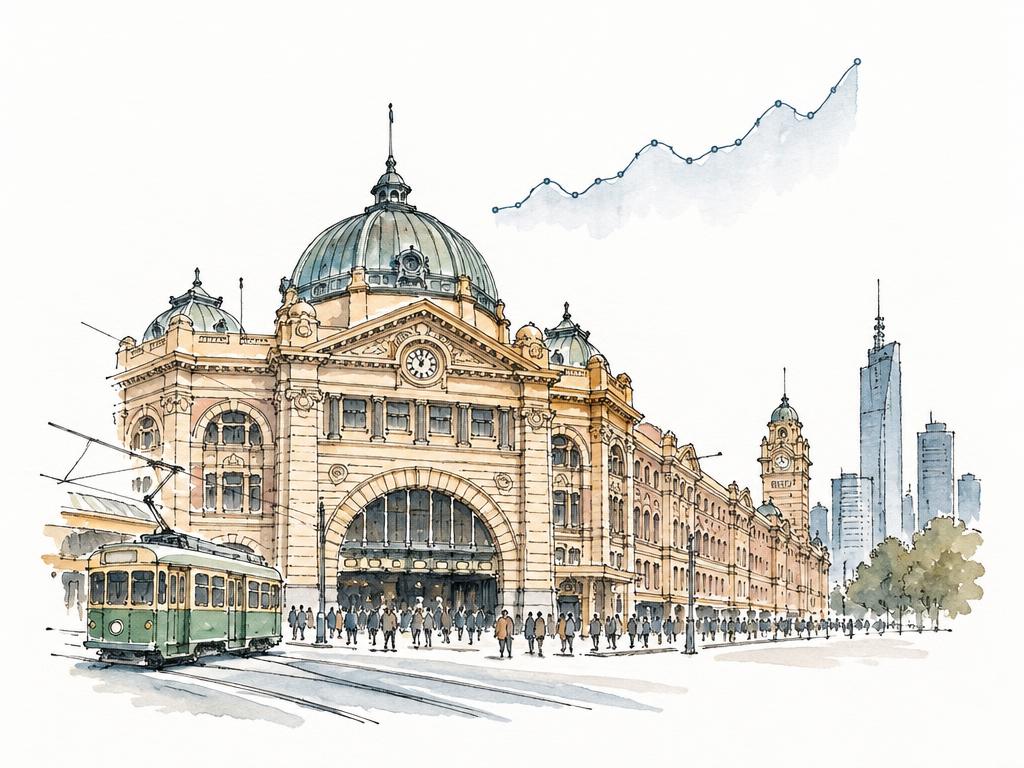
Melbourne, AU. Remote friendly.

feelings, scored

these move ↖

Let's make your data something people trust.

Hiring for a data role, or need help with a dashboard, automation or survey project? I usually reply within two business days.